Medium-term Business Plan
Medium-term Business Plan "Compass × Growth 2027"
"Compass × Growth 2027" expresses the Nichirei Group's desire to achieve growth as an indispensable presence in society by enhancing social and economic value, which was addressed in the previous medium-term business plan "Compass Rose 2024" toward the realization of the new long-term management goal "N-FIT 2035".
Medium-term Business Strategy
|
Strengthening profitability and improving capital efficiency
|
|
|---|---|
1. Deepening areas of competitive advantages and leveraging Group synergies
|
We will establish a firm position in Japan by setting and promoting profit drivers, which are the strategic categories, such as processed chicken products and rice products, in the Foods Business and the logistics platform for frozen foods in the Temperature-controlled Logistics Business. In addition, we will demonstrate Group synergies through the foods business integration and ensure improved profitability. |
2. Overseas business expansion based on regional strategies
|
We will pursue organic and inorganic business growth in Europe, ASEAN, and North America. |
3. Promoting human capital management and developing global governance, etc.
|
Promoting human capital management and developing global governance, etc. as a base for supporting sustainable growth. |
Financial and Non-financial Targets
Financial Targets
(Billion yen)
| FY2027 Targets | Compared to FY2024 Results | |
|---|---|---|
| Net Sales | 777.3 | 75.2 |
| Overseas sales ratio | 30.4% | 6.8pt |
| Operating Profit | 45.2 | 6.9 |
| Operating Profit/Net Sales | 5.82% | 0.3pt |
| Profit Attributable to Owners of Parent | 32 | 7.3 |
| EPS* | 127.7 | 30.4 |
| EBITDA | 71.2 | 8.6 |
| ROIC | 8% or higher |
- |
| ROE | 10% or higher |
- |
*EPS : As of April 1, 2025, a stock split was executed at a ratio of 2 shares for each common share. Therefore, it is assumed that the stock split took place at the beginning of the fiscal year ended March 2025 for calculation purpose.
Non-financial Targets
| FY2027 Targets | |
|---|---|
| Employee engagement score | 75pt |
| Human capital expenditures | ¥ 1.53 billion |
| CO2 emission reduction rate (Scope1+2) | -27% |
| Renewable energy rate | 53% |
| Net sales of products and services that create added value for people’s mental and physical health and for the global environment | ¥ 80.0 billion |
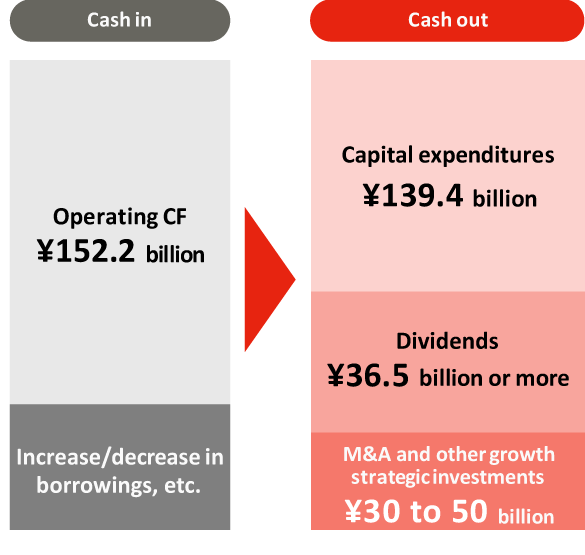
Financial Strategy (Cash Allocation and Capital Investment Plan)
- Operating cash flow will be allocated to investments in core businesses for future growth and shareholder returns.
- The D/E ratio is targeted at 0.5x from the perspective of financial soundness and capital efficiency, while leveraging and making effective use of debt when the need for large-scale fundraising arises due to inorganic growth.
- Regarding our capital investment plan, we will make aggressive investments overseas to increase profitability. In Japan, we will continue to invest in growth to strengthen the core of our foods and temperature-controlled logistics businesses, as well as in environmental initiatives that promote sustainable management.
- We will implement strategic investments to facilitate inorganic growth overseas in order to accelerate global expansion.
Breakdown of Capital Expenditures by Location
(Billion yen)
| Three-year cumulative total | |
|---|---|
| Japan | 84.4 |
| Overseas | 54.9 |
| Total | 139.4 |
Breakdown of Capital Expenditures by Purpose
(Billion yen)
| Three-year cumulative total | |
|---|---|
| Growth investment | 76.6 |
| Environmental measures | 11.2 |
| Others | 51.5 |
| Total | 139.4 |
Targets and Strategies by Segment
Financial Targets
(Billion yen)
| Segment | Net sales | Operating profit | ||
|---|---|---|---|---|
| Compared to FY2024 Results | Compared to FY2025 Results | |||
| Foods business | 447.5 | 13.6 | 22 | 0.7 |
| Temperature-controlled logistics business | 340 | 61.7 | 22.6 | 6.9 |
| Real estate business | 5 | -0.2 | 2 | 0.1 |
| Other | 5 | -1.5 | 0.5 | -0.6 |
| Adjustments | -20.2 | 1.6 | -1.9 | -0.2 |
| Total | 777.3 | 75.2 | 45.2 | 6.9 |
Strategies by Business Segment
Foods business (processed foods business and marine, meat and poultry products business)
- Accelerate the establishment of procurement and sales functions to realize group synergies through the integration of the processed foods business and the marine, meat and poultry products business.
- [Japan] Concentrate resources in strategic categories and restructure the sales composition by business type.
- [Overseas] Strengthen the foundations of existing businesses and create opportunities for inorganic growth.
Temperature-controlled logistics business
- [Japan] Develop a business infrastructure for the next generation and strengthen profitability.
- [Overseas] Prepare for sustainable growth of European business and rapid expansion of ASEAN business.
Other businesses (Bioscience business)
- Strengthen the development of reagents in the growing molecular diagnostics business and expand global sales.
- Strengthen product competitiveness of infectious disease antigen test kits and establish a production system for stable supply.
Shareholder Returns
To maximize shareholder value, we have changed our dividend policy to implement progressive dividends with a lower limit of Dividend on Equity (DOE) of 4.0%.
Shareholder returns under medium-term business plan periods
| Compass × Growth 2027 | The previous medium-term business plan results | |
|---|---|---|
| Dividends paid | \ 36.5 billion or more | \ 24.6 billion |
| Treasury stock purchased | - | \ 15.0 billion |
| Total return ratio | - | 56% |